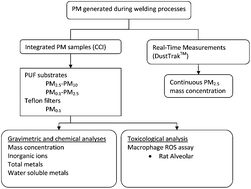
Richard Brown from the National Physical Laboratory, UK, discusses the causes and effects of data loss in environmental air sampling and proposes a modelling method for overcoming data loss for benzo(a)pyrene (BaP) concentrations.
If levels of a pollutant are not measured every day of every year, there will be inevitable gaps in the data. Often, it is not viable or necessary to sample every day and in the European Union there are minimum limits set on the time coverage (33% of the year) and data capture (90% of this time must result in valid data), and a maximum uncertainty of 50%. Such data should be obtained evenly over the year. Add to this the possibility for equipment breaking down, poor weather and quality control, this can mean significant gaps.
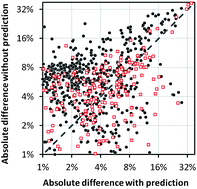 This is more of a problem when the concentration of the pollutant in question varies considerably with the season. BaP fits this category in urban and rural environments, but is more stable at industrial sites. The National Physical Laboratory is responsible for operating the UK PAH Monitoring network and Richard Brown here explores the effects of losing one month’s data for BaP and compares it against nickel in PM10, which varies relatively little over the year.
He concludes that there could be a maximum underestimation of 13.5% in January and an underestimation of up to 7.1% in July with industrial stations included, which have consistent emission rates. Removing industrial sites gives -16.0% and +7.6%. The annual average is therefore biased. In contrast, losing 6 consecutive months of data for Ni still only gives discrepancies of around +/-5%.
Brown shows that for urban and rural BaP levels, the data fits a quadratic function very well and therefore this can be used to predict missing data fragments. He tests this on a data set with a month’s data removed, comparing the calculated annual average from the full data set and the data set with predictions filling in the missing month. This works well, with exceptions in months where the conditions are significantly different to the average (for example, being much colder than previous years). Therefore, he suggests taking measured ambient temperature data into consideration in future. This method is quicker and less complex than using dispersion modelling approaches and improves annual average result accuracy for highly seasonal pollutants with a block of missing data.
Read the interesting discussion of this intricate problem now, as this article is free to access for the next 4 weeks*:
Data loss from time series of pollutants in ambient air exhibiting seasonality: consequences and strategies for data prediction
Richard J. C. Brown
DOI: 10.1039/C3EM30918E
*Free access to individuals is provided through an RSC Publishing personal account. Registration is quick, free and simple


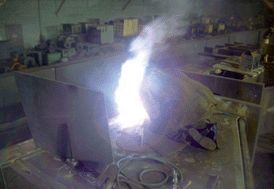 The aerosol compositions generated by industrial processes such as welding have been found to contain metal fumes, including those of manganese. Such fumes are potentially harmful and have been known to cause neurological and psychological problems.


 Antonia Praetorius