Archive for the ‘Infographic’ Category

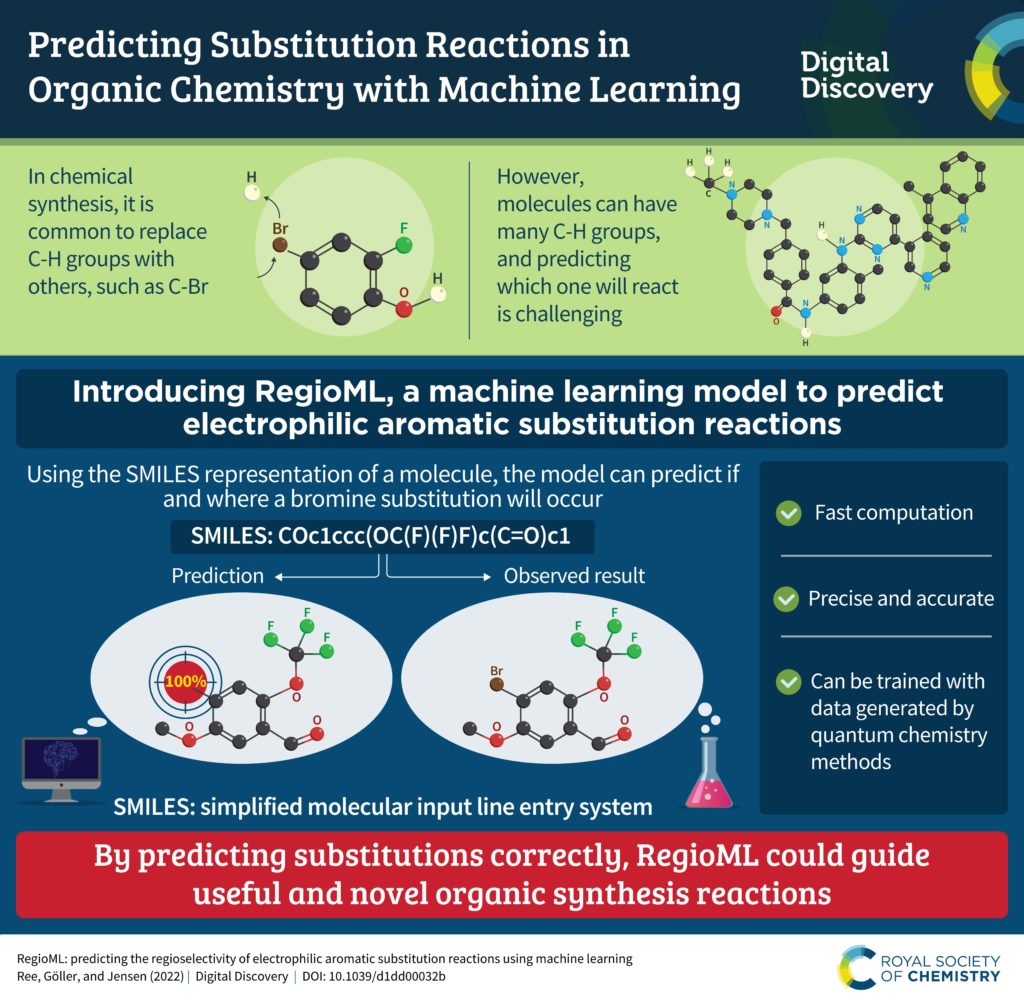
Research infographic – “RegioML: predicting the regioselectivity of electrophilic aromatic substitution reactions using machine learning”

An infographic describing the research in the paper at DOI 10.1039/D1DD00032B

We’re excited to share this new infographic about RegioML, work that was published in Digital Discovery issue 2. Read the entire open-access article at:

“Consideration of predicted small-molecule metabolites in computational toxicology”

Nicolai Ree, Andreas H. Göller and Jan H. Jensen, Digital Discovery, 2022, 1, 108–114, DOI:10.1039/D1DD00032B


 

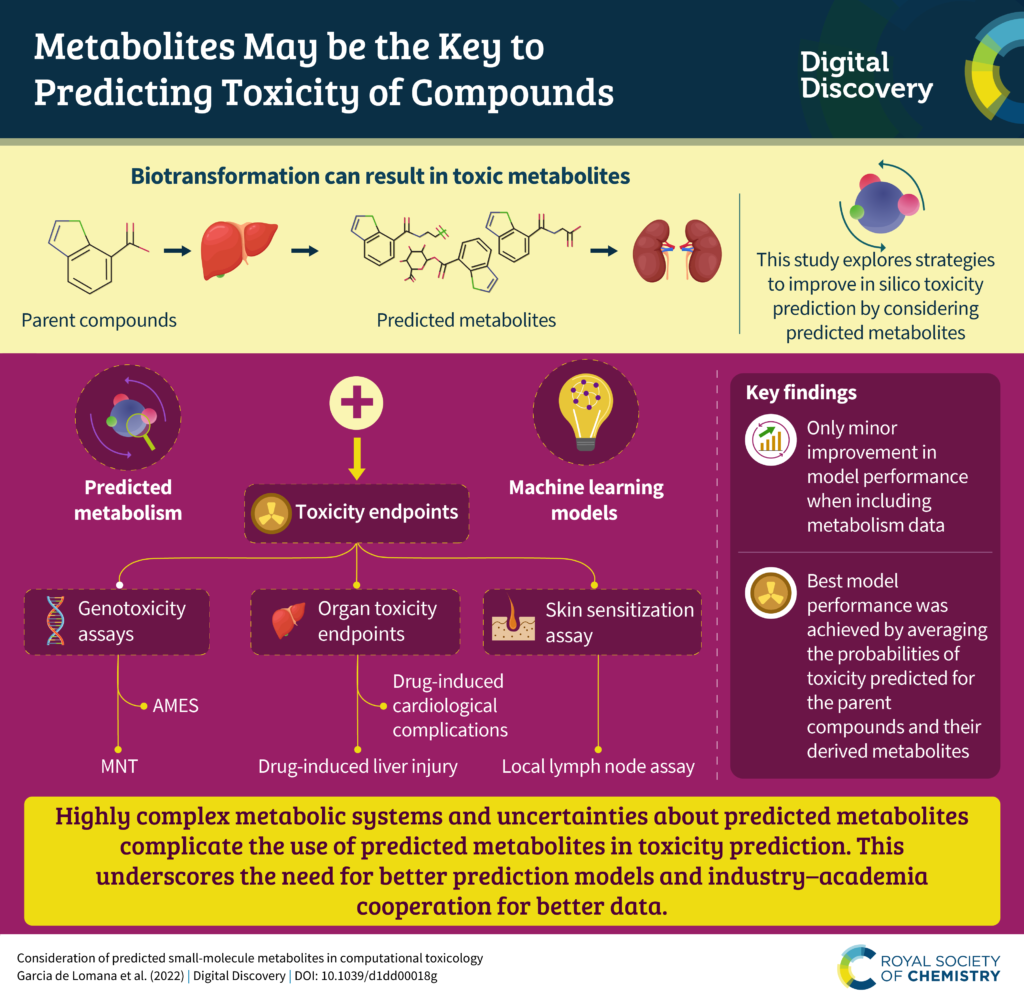
Research infographic – “Consideration of predicted small-molecule metabolites in computational toxicology”

An infographic describing the paper "Consideration of predicted small-molecule metabolites in computational toxicology", DOI 10.1039/D1DD00018G

Discover more about this research in the open access article:

Consideration of predicted small-molecule metabolites in computational toxicology

Miriam Mathea, Johannes Kirchmair et al.Digital Discovery, 2022, 1, 158–172. DOI:10.1039/D1DD00018G

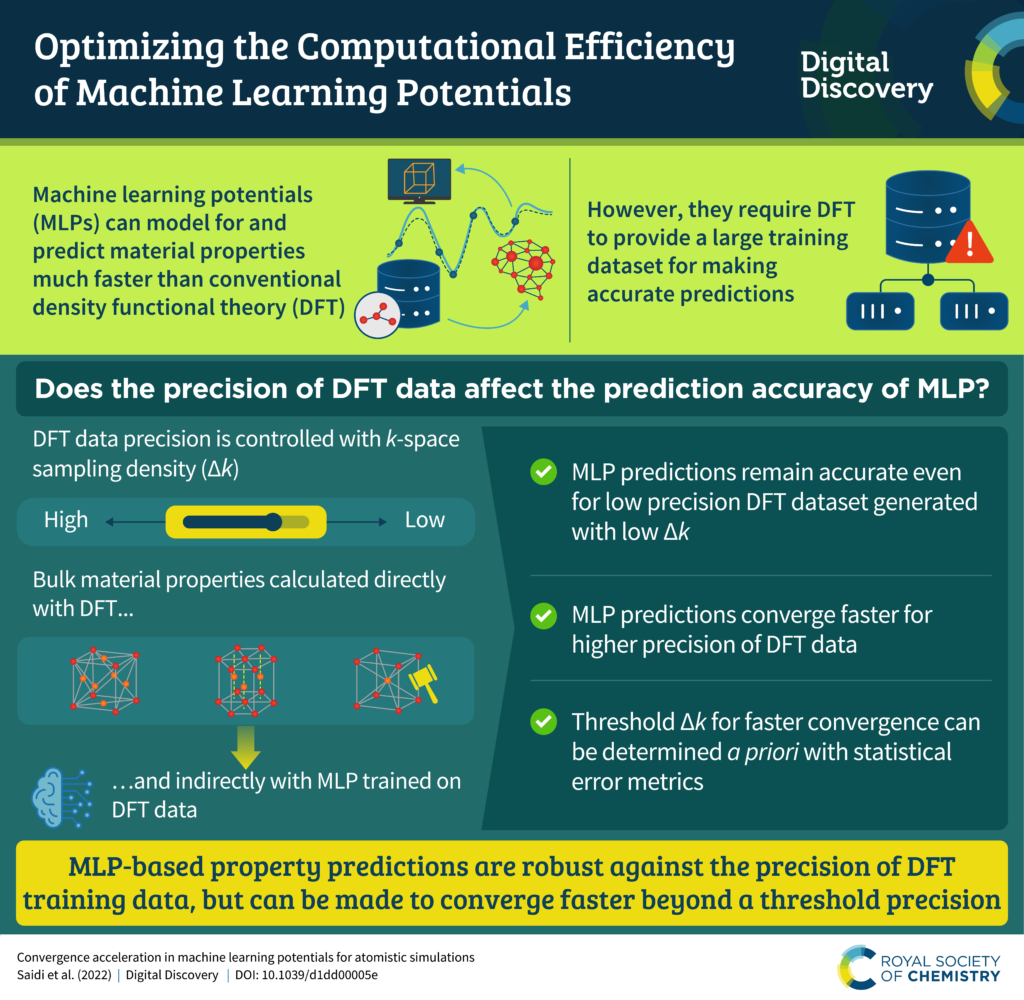
Research infographic – “Convergence acceleration in machine learning potentials for atomistic simulations”

An infographic describing the paper linked to in this post

Find out more in the open access article:

Convergence acceleration in machine learning potentials for atomistic simulations

Wissam A. Saidi et al.Digital Discovery, 2022, 1, 61–69. DOI:10.1039/D1DD00005E

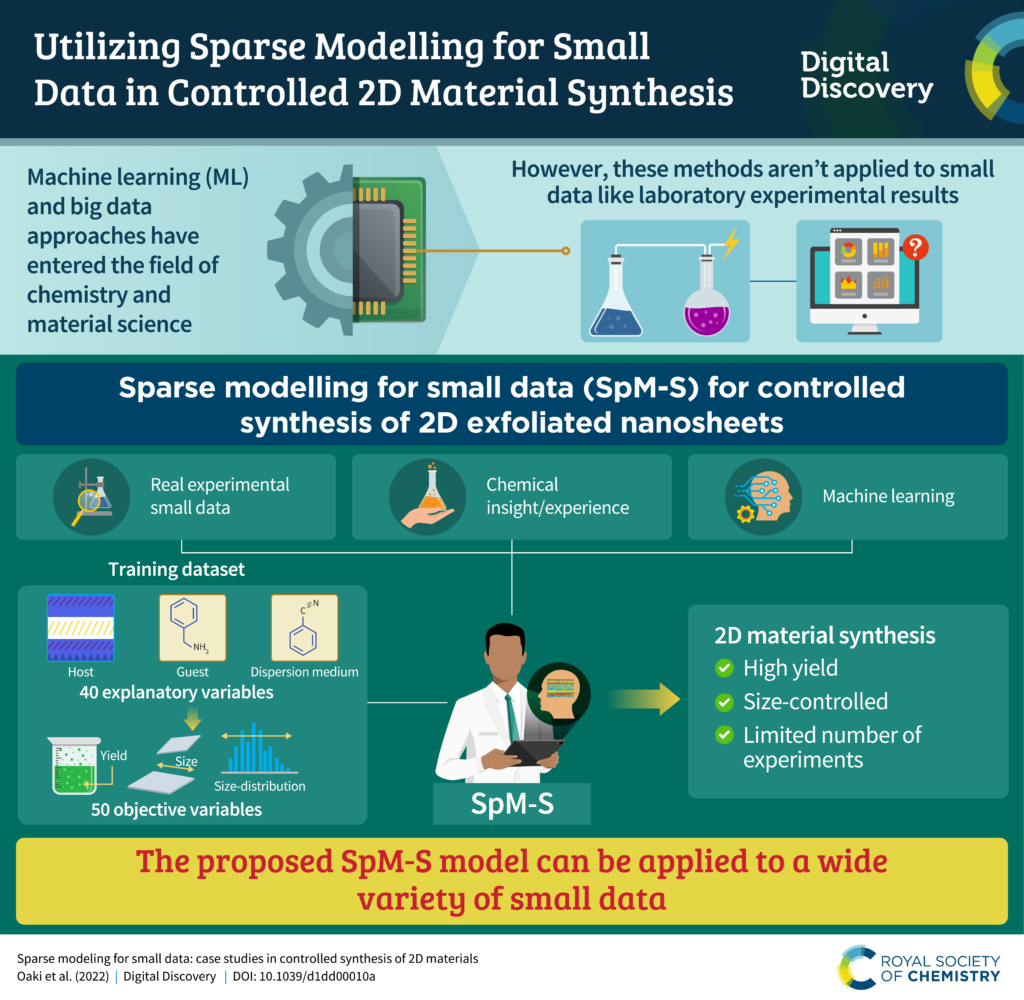
Research infographic – “Sparse modeling for small data: case studies in controlled synthesis of 2D materials”

An infographic describing the paper linked to in the article

Find out more in the free-to-read open access article:

Sparse modeling for small data: case studies in controlled synthesis of 2D materials

Yuya Oaki et al., Digital Discovery, 2022, 1, 26–34. DOI:10.1039/D1DD00010A