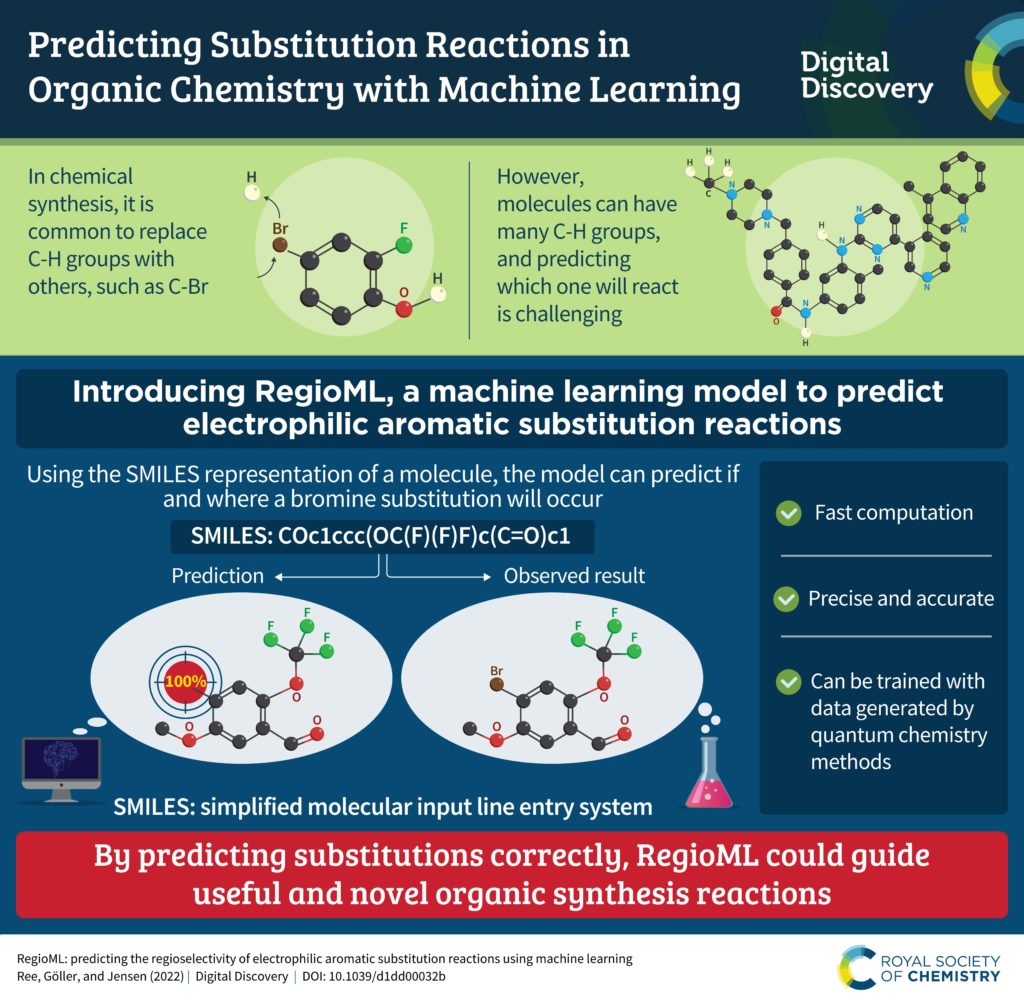
We’re excited to share this new infographic about RegioML, work that was published in Digital Discovery issue 2. Read the entire open-access article at:
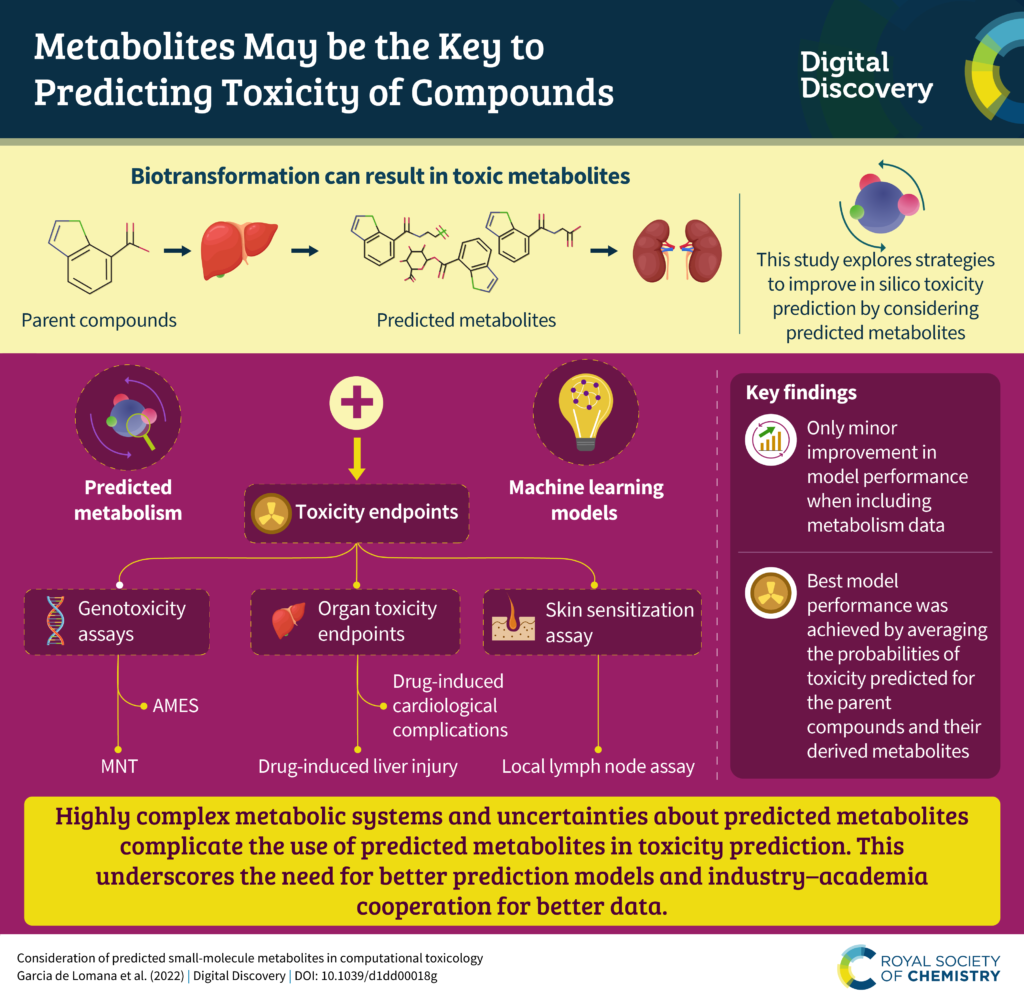
“Consideration of predicted small-molecule metabolites in computational toxicology”
Nicolai Ree, Andreas H. Göller and Jan H. Jensen, Digital Discovery, 2022, 1, 108–114, DOI:10.1039/D1DD00032B