Motohiko Nohmi, Fluid Machinery Research Center, EBARA Research Co., Ltd., Japan
Juan G. Santiago, Mechanical Engineering Department, Stanford University, CA, USA
Why is this useful?
We present a simple way of estimating electroosmotic flow velocities in channel geometries with at least one intersection. The method is useful where a well-defined electrokinetic injection of a discrete plug of a neutral dye (the typical method, [1]) is not easily obtained given available equipment (e.g., when working with a primitive voltage sequencer or an insensitive CCD).
What do I need?
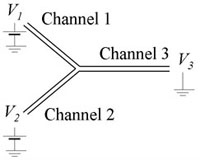
- Microfluidic device with at least one intersection (Fig. 1)
- CCD/CMOS camera
- Epi-fluorescence microscope
- Voltage control device that can switch potentials at two nodes
- Neutral dye (e.g., 100 µM Rhodamine B)
- Chemical buffers
What do I do?
1. We assume here that the channel is expected to have a negative wall charge, but simple observations with a fluorescent solution can confirm this. We add dyed solution to reservoir 1. For a symmetric network (e.g., Fig. 1), keeping the sum V1+V2 constant will maintain a uniform electric field in the outlet Channel 3.
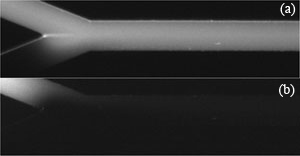
2. As a preliminary observation, vary V1 and V2 and test the limits which will initiate reverse flow in channels 1 or 2. Figure 2 shows example limits for a given maximum potential of (a) V1 = 1175 V, V2 = 925 V and (b) V1 = 925 V, V2 = 1175 V. We’ll refer to these voltage limits as V1,high, V2,low, V1,low and V2,high. (See [2] for predicting these voltages.)
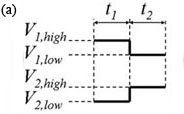
3. The voltage controller should alternate V1 and V2 as shown in Fig. 3(a). Experiment with t1 and t2 so that the flow has a noticeable disturbance propagating into channel 3 as shown in the movie of Fig. 3(b) (download below). In Fig. 3(b), t1 and t2 are both 1 s, Vhigh = 1100 V, Vlow = 900 V and the image sequence was captured with 50 ms exposure time and 64.6 ms time-between-frames.
Figure 3. (a) One cycle of control voltages V1 and V2. The duration of each of the two states is t1 and t2, respectively (typically t1 = t2). Triangular or sinusoidal waves can be used, but require better equipment and a more complex setup. (b) Visualization of flow showing propagation of disturbances flowing down channel 3 (see video below).
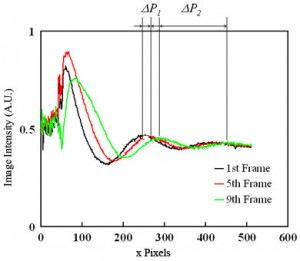
4. Capture an image sequence of modulated flow near the entrance of channel 3 (4-5 periods should be enough). Extract the values of image intensity along the approximate centerline of the channel. For better results, average a few pixel rows centered along the channel centerline. Fig. 4 shows raw data for the dye intensity of the centerline of the 1st, 5th and 9th frame of an image sequence of the movie of Fig.3(b). For a simple velocity estimate, analyze the second peak into the channel (where the velocity field is approximately parallel and fully developed). From the two traces in Fig. 4, peak displacement over three frames is about Capital DeltaP1 = 20 pixels or u=k*Capital DeltaP1/Capital Deltatf= 131 µm/s (Eq. (1)). Here k is the number of imaged microns per pixel, Capital DeltaP1 = 20 pixels , and Capital Deltatf is the time interval of the movie frame. You can also estimate velocity from the wavelength of the disturbance (and the known cycle time, 2 s): u=k*Capital DeltaP2/(t1+t2)= 138 µm/s (Eq. (2)). Here, Capital DeltaP2 (= 165 pixels) is the length between two dye peaks in a single image and t1+t2 is the cycle time of voltage modulation. These two approximate velocity measurements typically agree to within about 8%. The latter method is particularly useful when only a single image is available.
Equation (1).
Equation (2).
Figure 4. Dye intensity along the centerline of the 1st, 5th and 9th frames of of an image sequence of the propagating wave near the inlet of channel.
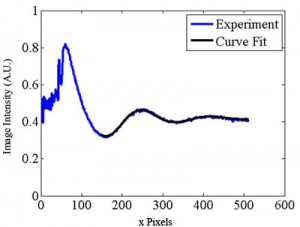
5. The methods described above are susceptible to noise in the image data, among other factors. A more reliable technique uses multiple measurements and ensemble averages. One way to accomplish this is using a fitting routine to analyze the waveform of Fig. 4. We choose the following function:
Equation (3).
The coefficients of Eq. (3) can be estimated for each movie frame as shown in Fig. 5 (download below) by using the Gauss-Newton nonlinear least-squares data fitting routine “nlinfit” in MATLAB. The averaged wavelength Capital DeltaP2ave is calculated as 2Pi/C3ave = 166.8 pixels and the averaged velocity is calculated as 140 µm/s using Eq. (2). The velocity is also determined from the phase velocity C4 in Eq.(3) as follows.
Equation (4).
In Eq. (4), dC4/dt is calculated using a linear regression fit of the C4 data vs. time for 200 images. C4 changes linearly in time, and the phase velocity dC4/dt can be calculated by using a linear regression fit of the C4 data vs. time for 200 images. The wave travels one wavelength for the time of 2Pi/(dC4/dt), so the velocity of the fluid is determined as the averaged wavelength divided by 2Pi/(dC4/dt) as described in Eq. (4).
Figure 5. Spatial image intensity variation along channel centerline for a single image as a function of distance along the separation channel (in pixels). Shown with the data is a curve of the form of Eq. (3). (See .avi file below).
References
[1] S. Devasenathipathy and J. G. Santiago, “Electrokinetic Flow Diagnostics” in Micro- and Nano-Scale Diagnostic Techniques, ed. K. Breuer, New York, Springer Verlag, 2004.
[2] K. V. Sharp, R. J. Adrian, J. G. Santiago, and J. I. Molho, “Liquid Flows in Microchannels” in CRC Handbook of MEMS, ed. M Gad-el-Hak, CRC Press, New York, 2001, pp. 6-1 to 6-38.
Related links
Figure 3b .avi file
Visualization of flow showing propagation of disturbances flowing down channel 3.
Figure 5 .avi file
Spatial image intensity variation along channel centerline for a single image as a function of distance along the separation channel (in pixels).


