Archive for the ‘Chip metrics’ Category

A simple technique for feeding constant rate of flow

Piotr M. Korczyk [1,2], Olgierd Cybulski [1], Sylwia Makulska [1] and Piotr Garstecki [1]
[1] Institute of Physical Chemistry, Polish Academy of Sciences, Kasprzaka 44/52, 01-224 Warsaw, Poland
[2] Institute of Fundamental Technological Research, PAS, Pawinskiego 5B, 02-106 Warsaw, Poland

Why is this useful?


Syringe pumps are known to generate fluctuation of rate of flow (1). In some applications the impact of these oscillations can be relevant. We demonstrate and characterize in detail a simple method for feeding fluids into microfluidic devices at a constant rate of flow. This simple experimental setup provides for more precise control and for better stability of the rate of flow than the commonly used syringe pumps.

What do I need?


  • Source of pressurized gas
  • Tubing for pressurised gas
  • Pressure regulator
  • Pressure transducer
  • Container for pressurized liquid
  • Polyethylene tubing
  • Steel capillaries
  • Tygon tubing
  • Needles

How do I do it?


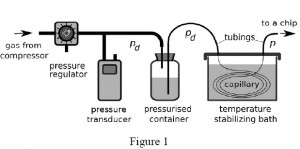
1. Connect pressure source with pressure regulator via tubing and then with the pressurized container filled with carried liquid (Fig. 1).

2. Place pressure transducer between the regulator and the container (Fig. 1).

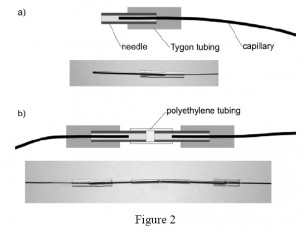
3. For connections between the polyethylene tubing and the steel capillaries use short sections of the Tygon tubing. In order to avoid obstruction of the terminus of the capillary by the elastic Tygon, first put a blunted needle all the way through the Tygon tubing. Then insert the terminus of the capillary into the needle, and partially withdraw the needle from the Tygon to let it squeeze around the capillary and seal the connection (Fig. 2).

4. Connect the end of the capillary with the pressurised container for liquid via a polyethylene tubing and the other end of the capillary with the chip (Fig. 1).
5. Place the resistive capillary into a temperature stabilizing bath of liquid (e.g. water) to avoid temperature fluctuations which can affect viscosity of the liquid guided through the capillary and its hydraulic resistance to flow (Fig. 1).

What else should I know?


Using the resistive capillaries for delivering stable rates of flow requires calibration of the hydraulic resistance of the capillary. First estimate the Reynolds number for the flow on the basis of the dimensions of the capillary and the range of required rates of flow. If the flow is laminar, the relation between the pressure P applied to the container with liquid and the rate of flow Q through the capillary is linear: P=RQ  where R is the hydrodynamic resistance. In order to calibrate for R place the capillary in the bath and apply a known pressure to the container. Then evaluate the rate of flow by measuring the rate of change of mass on an analytical balance collecting the liquid flowing out from the capillary.

The ratio of P/Q yields R. Alternatively, for more precise calibration collect a number of values of Q for different values of P and fit a line: P = RQ  to retrieve R.

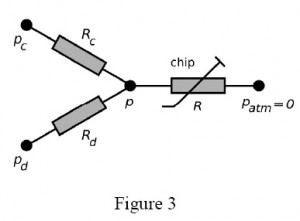
Figure 3 presents example of the equivalent electric circuit of the system that draws a continuous liquid (under pressure pc and a to-be-dispersed fluid (pd) from pressurized containers to form droplets on a microfluidic chip. The capillaries have hydrodynamic resistances Rc, Rd, the pressure at the droplet generator is p. The droplets flow through a channel of resistance R (varying, due to the generation and motion of droplets) up to the outlet (pressure 0, since all pressures are relative to the atmospheric pressure).

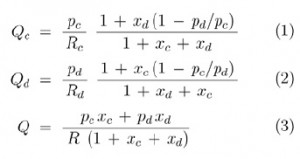
In general, having capillaries of known resistance (e.g. already calibrated for a desired liquid), one may easily calculate the rates of flow of the continuous phase (Qc) and of the droplet phase (Qd) from Ohm and Kirchhoff circuit laws:

where  xc = R/Rc and xd = R/Rd.

It should be noted that although Qc and Qd are not mutually independent functions of respective pressures pc and pd, the cross-dependency becomes irrelevant for small values of xc and xd i.e. when the resistance of the capillaries is much larger than the resistance of the chip. Keeping Rc >> R and Rd >> R also minimized the variation of Qc and Qd in response to the variation of R. It is practical to to have pc and pd of similar magnitude, hence for a given range of rates of flow the user should tailor resistance of capillaries to meet the following condition: Rc / Rd ≈ Qd /Qc.

References


(1) R. Green and S.A. Vanapalli, Quick assessment of the stability of flow generated by a syringe pump in a microfluidic device, Chips & Tips (Lab on a Chip), 16 July 2009.

(2) P. Korczyk, O. Cybulski, S. Makulska, P. Garstecki, Effects of unsteadiness of the rates of flow on the dynamics of formation of droplets in microfluidic systemsLab Chip, DOI:10.1039/C0LC00088D.

Digg This
Reddit This
Stumble Now!
Share on Facebook
Bookmark this on Delicious
Share on LinkedIn
Bookmark this on Technorati
Post on Twitter
Google Buzz (aka. Google Reader)

Quick assessment of the stability of flow generated by a syringe pump in a microfluidic device

Rachel Green and Siva A. Vanapalli
Department of Chemical Engineering, Texas Tech University, Lubbock, TX, USA

Why is this useful?


Syringe pumps are often used in a variety of microfluidic applications because of their portability and the ease with which flow rates can be changed. The syringe pump characteristics (type, age and wear), compliance in the tubing, a mismatch between the size of syringe used and the flow rate desired can generate pulsations in microfluidlic flows. These pulsations could be undesirable for lab-on-a-chip applications in which steady fluid flows are needed. The method described here is a quick means to assess the degree of pulsations present in flows driven by syringe pumps. The basic principle relies on using a microfluidic comparator [1,2] to detect small pressure fluctuations in fluid flows.

What do I need?


  • Microfluidic device with design as shown in Figure 2.
  • Ring stand
  • Ring stand clamp
  • Syringe pump
  • Distilled water
  • Dyed distilled water (refill ink)
  • Syringe (30 or 60 mL)
  • Tubing
  • Stereomicroscope

What do I do?


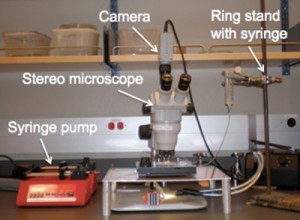
1. Set up ring stand with a wide-mouth syringe in the ring stand clamp (Figure 1). This is your hydrostatic head. The distilled water will go in this syringe.

Figure 1: Setup of the ring stand and syringe pump with the microfluidic device.

2. Place a syringe with the dyed distilled water into the syringe pump.

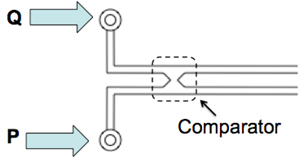
3. As shown in Figure 2, connect the syringe pump to the chip (labeled as flow rate Q). Connect the hydrostatic head, P, from the ring stand to the chip.

Figure 2: Microfluidic chip integrated with the comparator.

The outlets are open to atmospheric pressure. The device consists of two identical channels connected downstream to form a comparator region. At one inlet we impose a constant hydrostatic pressure (P) to generate steady flow and in the other inlet we use a syringe pump to introduce fluid admixed with a dye at a flow rate, Q.

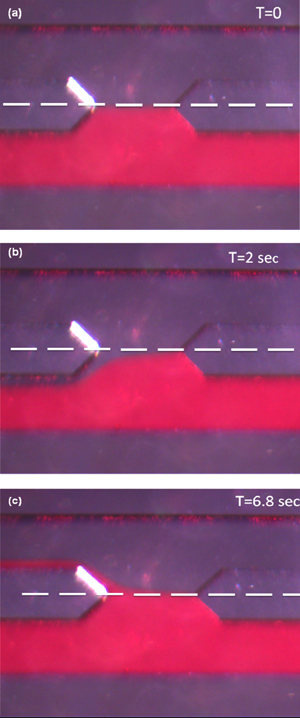
4. Start the syringe pump at the desired flow rate. Vary the height of the hydrostatic head until the two fluid flows meet at the symmetry line of the comparator (see the white line in Figure 3a).

5. Because the hydrodynamic resistances of the two channels are equal, if any pulsations are present in the syringe-pump driven flow then the dyed fluid will be displaced above or below the symmetry line (shown in white) in the comparator, as shown in Figure 3b and 3c.

Figure 3: Images of the fluid-fluid interface in the comparator at different times.

(a) The flows are steady and balanced. (b) After a time interval of 2 seconds, the dyed fluid is below the symmetry line indicating the syringe pump flow rate is lower than the flow rate corresponding to the imposed hydrostatic pressure. (c) After 6.8 seconds, the dyed fluid flow is above the symmetry line, indicating the syringe pump flow rate is greater than the flow rate corresponding to the imposed hydrostatic pressure.

What else should I know?


The method described is a quick assessment of the pulsations generated by syringe pump driven flow. For a more in depth study, we recommend using a precision hydrostatic head rather than a ring stand. We built a stand that can hold a syringe on a precision linear translation stage (Edmund Optics, Part # NT56-796). The stage allows the hydrostatic head to be adjusted at 0.1 mm intervals. Using this hydrostatic head and a video camera, one can precisely determine the number of fluctuations per unit time for a specified pump, flow rate, syringe size and tubing.

References


1. M. Abkarian, M. Faivre and H. A. Stone, Proc. Natl. Acad. Sci., 2006, 103, 538-542
2. S. A. Vanapalli, D. van den Ende, M. H. G. Duits and F. Mugele, Appl. Phys. Lett., 2007, 90, 114109

Digg This
Reddit This
Stumble Now!
Share on Facebook
Bookmark this on Delicious
Share on LinkedIn
Bookmark this on Technorati
Post on Twitter
Google Buzz (aka. Google Reader)

Quick measurement of electroosmotic flow velocity

Motohiko Nohmi, Fluid Machinery Research Center, EBARA Research Co., Ltd., Japan
Juan G. Santiago, Mechanical Engineering Department, Stanford University, CA, USA

Why is this useful?


We present a simple way of estimating electroosmotic flow velocities in channel geometries with at least one intersection.  The method is useful where a well-defined electrokinetic injection of a discrete plug of a neutral dye (the typical method, [1]) is not easily obtained given available equipment (e.g., when working with a primitive voltage sequencer or an insensitive CCD).

What do I need?


  • Microfluidic device with at least one intersection (Fig. 1)
  • CCD/CMOS camera
  • Epi-fluorescence microscope
  • Voltage control device that can switch potentials at two nodes
  • Neutral dye (e.g., 100 µM Rhodamine B)
  • Chemical buffers

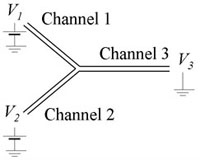
Figure 1. Electrokinetic microchannel device with a simple Y-Channel topology. The end-channel potentials are V1, V2, and V3.

What do I do?


1. We assume here that the channel is expected to have a negative wall charge, but simple observations with a fluorescent solution can confirm this.  We add dyed solution to reservoir 1.  For a symmetric network (e.g., Fig. 1), keeping the sum V1+V2 constant will maintain a uniform electric field in the outlet Channel 3.

2. As a preliminary observation, vary V1 and V2 and test the limits which will initiate reverse flow in channels 1 or 2. Figure 2 shows example limits for a given maximum potential of (a) V1 = 1175 V, V2 = 925 V and (b) V1 = 925 V, V2 = 1175 V.  We’ll refer to these voltage limits as V1,high, V2,low, V1,low and V2,high.  (See [2] for predicting these voltages.)

Figure 2. Given a maximum (convenient) voltage limit V1,high = V2,high, voltages V1 and V2 can be adjusted to find suitable combinations of V1 and V2 which lead to zero back flow. (a) V1,high and V2,low (b) V1,low and V2,high.

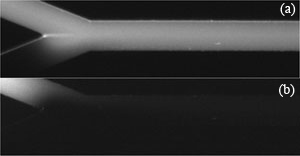
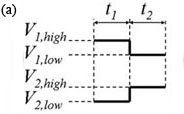
3. The voltage controller should alternate V1 and V2 as shown in Fig. 3(a).  Experiment with t1 and t2 so that the flow has a noticeable disturbance propagating into channel 3 as shown in the movie of Fig. 3(b) (download below).  In Fig. 3(b), t1 and t2 are both 1 s, Vhigh = 1100 V, Vlow = 900 V and the image sequence was captured with 50 ms exposure time and 64.6 ms time-between-frames.

Figure 3. (a) One cycle of control voltages V1 and V2.  The duration of each of the two states is t1 and t2, respectively (typically t1 = t2).  Triangular or sinusoidal waves can be used, but require better equipment and a more complex setup.  (b) Visualization of flow showing propagation of disturbances flowing down channel 3 (see video below).

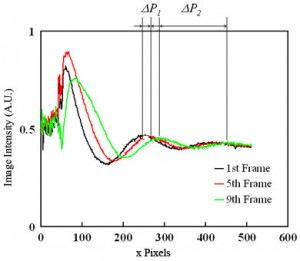
4. Capture an image sequence of modulated flow near the entrance of channel 3 (4-5 periods should be enough).  Extract the values of image intensity along the approximate centerline of the channel.  For better results, average a few pixel rows centered along the channel centerline.  Fig. 4 shows raw data for the dye intensity of the centerline of the 1st, 5th and 9th frame of an image sequence of the movie of Fig.3(b).  For a simple velocity estimate, analyze the second peak into the channel (where the velocity field is approximately parallel and fully developed).  From the two traces in Fig. 4, peak displacement over three frames is about Capital DeltaP1 = 20 pixels or u=k*Capital DeltaP1/Capital Deltatf= 131 µm/s (Eq. (1)).  Here k is the number of imaged microns per pixel, Capital DeltaP1 = 20 pixels , and Capital Deltatf is the time interval of the movie frame. You can also estimate velocity from the wavelength of the disturbance (and the known cycle time, 2 s):  u=k*Capital DeltaP2/(t1+t2)= 138 µm/s (Eq. (2)).  Here, Capital DeltaP2 (= 165 pixels) is the length between two dye peaks in a single image and t1+t2  is the cycle time of voltage modulation. These two approximate velocity measurements typically agree to within about 8%. The latter method is particularly useful when only a single image is available.

Equation (1).

Equation (2).

Figure 4. Dye intensity along the centerline of the 1st, 5th and 9th frames of of an image sequence of the propagating wave near the inlet of channel.

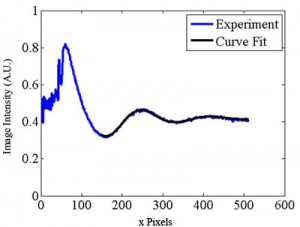
5. The methods described above are susceptible to noise in the image data, among other factors.  A more reliable technique uses multiple measurements and ensemble averages.  One way to accomplish this is using a fitting routine to analyze the waveform of Fig. 4.  We choose the following function:

Equation (3).

The coefficients of Eq. (3) can be estimated for each movie frame as shown in Fig. 5 (download below) by using the Gauss-Newton nonlinear least-squares data fitting routine “nlinfit” in MATLAB. The averaged wavelength Capital DeltaP2ave is calculated as 2Pi/C3ave  = 166.8 pixels and the averaged velocity is calculated as 140 µm/s using Eq. (2).  The velocity is also determined from the phase velocity C4 in Eq.(3) as follows.

Equation (4).

In Eq. (4), dC4/dt is calculated using a linear regression fit of the C4 data vs. time for 200 images. C4 changes linearly in time, and the phase velocity dC4/dt can be calculated by using a linear regression fit of the C4 data vs. time for 200 images. The wave travels one wavelength for the time of 2Pi/(dC4/dt), so the velocity of the fluid is determined as the averaged wavelength divided by 2Pi/(dC4/dt) as described in Eq. (4).

Figure 5. Spatial image intensity variation along channel centerline for a single image as a function of distance along the separation channel (in pixels). Shown with the data is a curve of the form of Eq. (3). (See .avi file below).

References


[1] S. Devasenathipathy and J. G. Santiago, “Electrokinetic Flow Diagnostics” in Micro- and Nano-Scale Diagnostic Techniques, ed. K. Breuer, New York, Springer Verlag, 2004.
[2] K. V. Sharp, R. J. Adrian, J. G. Santiago, and J. I. Molho, “Liquid Flows in Microchannels” in CRC Handbook of MEMS, ed. M Gad-el-Hak, CRC Press, New York, 2001, pp. 6-1 to 6-38.

Related links


Figure 3b .avi file
Visualization of flow showing propagation of disturbances flowing down channel 3.

Figure 5 .avi file
Spatial image intensity variation along channel centerline for a single image as a function of distance along the separation channel (in pixels).

Digg This
Reddit This
Stumble Now!
Share on Facebook
Bookmark this on Delicious
Share on LinkedIn
Bookmark this on Technorati
Post on Twitter
Google Buzz (aka. Google Reader)

Superior data presentation of poor quality microfluidics images

Richard J. Holmes and Nicholas J. Goddard
School of Chemical Engineering and Analytical Science (SCEAS),The University of Manchester, Manchester, UK

Why is this useful?


A number of journals (including Lab on a Chip) provide space to upload image and movie data alongside publications on the web.  However, the print publication must also contain sufficient illustrations to facilitate the understanding of the content without reference to such files.  This tip demonstrates the use of a low cost image analysis system which may be used to facilitate data presentation of poor quality video images for use in paper-based publications.  This is especially important in the field of miniaturisation and microfluidics, where video data is often the most convenient format (sometimes the only format) in which to record results.

What do I need?


This work was conducted using an Apple iBook G4 1.42 MHz laptop running OSX Tiger 10.4.8. Additional software is listed below.  Links to external websites with these resources are provided.

  • Quicktime Pro, the £20 ($30) upgrade from Quicktime standard facilitates rudimentary video editing, single frame extraction, multiple frame sequence extraction and basic post-processing functions such as the ability to vary the playback speed.
  • Graphics Converter X, a £20 ($30) shareware application from Lemkesoft offers a multitude of image processing functions and facilitates post-processing of image and movie data to a variety of formats.
  • ImageJ, a free (open source) java application offers calibrated measurements functions, windowing, colour processing, edge detection and surface plot functions alongside many others.

What do I do?


The procedure described here uses a microfluidic system developed in-house, and demonstrating hydrodynamic flow of a fluorescent labelled microsphere along a 30 mm channel (500 µm x 500 µm). Illumination was provided using a DPSS laser emitting at 473 nm (laser 2000, Kettering, UK) with an integrated beam expander.

1. Video data can be initially captured as a video file (avi, mov, mp4, etc) with Quicktime Pro being used to edit the video file to a manageable size by removing extraneous frames. Once the required file is prepared, it is then used to export a sequence of frames as JPEG images.

2. The JPEG images can then be imported into Graphics Converter X cropping the region of interest from each frame, allowing for the preparation of individual JPEG files at specific time intervals. Figure 1 shows an example image.

Figure 1: Windowed region of interest – fluorescent bead migrating in a microchannel

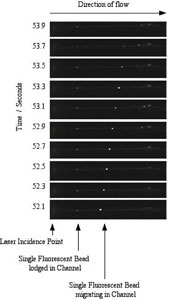
3. After each image is processed as above, a montage of these frames can be created in Graphics Converter X to illustrate the migration of the fluorescent bead as a function of time.

Figure 2: Compiled single frames illustrating bead migration under hydrodynamic flow in the microchannel

White space can used to space and easily identify the specific “snap-shot” images in the compiled file (Figure 2). However, a black fill tool should be applied to this white background to prevent the data being swamped by the background after processing. The image should be exported as an uncompressed JPEG with 8-bit (256 grays) resolution, corresponding to the internal scale required for ImageJ.

4. The montage JPEG is imported into ImageJ for processing, where the images shown in Figures 1 and 2 are converted to surface plots with the Z axis representing pixel intensity of the image.

Figure 3: Surface plot of data obtained from Figure 1 – illustrating a single frame of the experiment

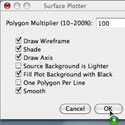
Figure 3 illustrates the surface plot of a single frame, as seen in Figure 1, with Figure 4 illustrating the settings options defined in ImageJ.

Figure 4: Settings menu used in ImageJ to obtain the surface plot functions

5. The surface plot of the white space corrected Figure 2 can be seen in Figure 5, illustrating the migration over time of a fluorescently labelled microsphere under hydrodynamic flow conditions.

Figure 5: White space-corrected surface plot of Figure 2 data, illustrating the migration over time of a fluorescently labelled microsphere under hydrodynamic flow conditions

It can easily be seen in the figures that data represented in this way significantly improves the quality of the output in terms of usability. It should be noted that the trade-off with this technique is in terms of its limited numerical value due to the conversion and compression across file formats and the subsequent loss of data, especially since one of the major limiting factors is the initial quality and resolution of the images obtained. As such, care should be taken when converting data files and ideally, quantitative data should be extracted from uncompressed files only, so as to maintain integrity.

What else should I know?


Ideally, video files should be recorded using high-speed, high frame rate equipment, thereby facilitating discrimination between events on the microsecond scale, thereby improving resolution and reducing the potential for streaking effects.
However, by careful use of a few relatively easy techniques, low quality AVI movie files (hampered by camera resolution, magnification factors and illumination / contrast issues, all of which are prevalent in microfluidics research), which would not usually stand up as results in a major publication may  be utilised to their fullest potential, and the small white dot of a few pixels in figure 1 representing the fluorescent bead, becomes a distinct peak, easily distinguished from the background signal.
Whilst this work has been conducted using an Apple Macintosh, it should be noted that similar applications are available for computer systems running Windows and Linux. Additionally, the system mentioned is far more versatile than the single application shown in this tip. The range of functions for such low cost software makes this an essential component in the arsenal of any microfluidics researcher.

Digg This
Reddit This
Stumble Now!
Share on Facebook
Bookmark this on Delicious
Share on LinkedIn
Bookmark this on Technorati
Post on Twitter
Google Buzz (aka. Google Reader)