A group of scientists from Columbia University in United States have developed a state-of-the-art probing technique that can simultaneously map glucose uptake and incorporation activities in living cells.
Glucose is a ubiquitous “fuel” for most living organisms. Its metabolism, including uptake and incorporation, is vital to sustain the energy consumption of living organisms. Visualization of glucose metabolism is of critical importance for clinical diagnostics and fundamental biological researches. However, current imaging techniques are destructive to living cells, poorly resolved or incapable of probing uptake and incorporation at the same time.
Now in ChemComm, Prof. Min Wei’s research team demonstrates a breakthrough based on a vibrational imaging technique coupled with stimulated Raman scattering microscopy. This technique utilizes two glucose analogues to present the glucose metabolism, the 13C-labelled 3-O-propargyl-D-glucose (3-OPG-13C3) for glucose uptake and the D7-glucose for glucose incorporation. Conventional Raman spectroscopy is unable to distinguish the aforementioned two species due to their overlapping Raman peaks. The authors addressed this challenge by labelling 3-OPG with 13C that exhibits a blue shifted Raman peak, thus separating it from the peak of D7-glucose. Decoupling of the two peaks allows in-vivo imaging and simultaneous observation of glucose uptake and incorporation in cells with sub-cellular resolution.
Figure 1 shows the two-color mapping images collected for human cancer cells, PC-3. The blue (panel a) and red (panel b) areas display the regions where glucose incorporation and uptake are taking place, respectively. The two images can be easily obtained by tuning the wavenumber of the incident light to match with corresponding Raman peak positions. Use of light with other wavenumbers results in the black image (panel c) containing virtually no colored regions, showing the excellent selectivity of the technique. Additionally, this approach differentiates between cancer cells and healthy cells by comparing the blue to red color intensity ratio.
This novel and versatile imaging technique is expected to serve as a useful tool in advanced bio-imaging and future cancer diagnostics.
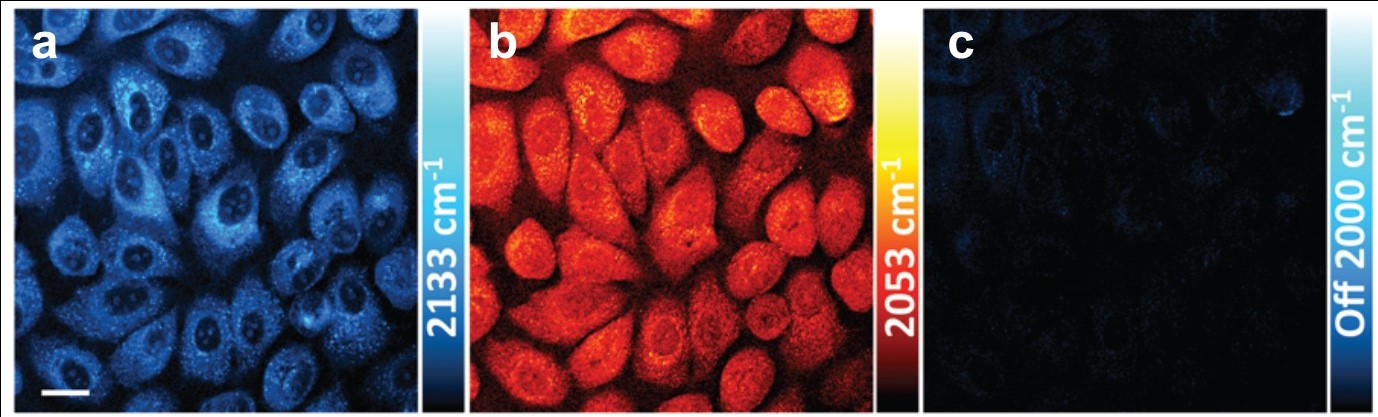
Figure 1. Two-color mapping images of PC-3 cells highlighting the (a) glucose-incorporation regions (Raman peak: 2133 cm-1) and (b) glucose-uptake regions (Raman peak: 2053 cm-1). (c) An image collected with a wavenumber (2000 cm-1) that does not match with either of the Raman peaks. Scale bar: 20 µm.
To find out more please read:
Two-color Vibrational Imaging of Glucose Metabolism Using Stimulated Raman Scattering
Rong Long, Luyuan Zhang, Lingyan Shi, Yihui Shen, Fanghao Hu, Chen Zeng and Wei Min
Chem. Commun. 2018, DOI: 10.1039/C7CC08217G
About the blogger:
 Tianyu Liu obtained his Ph.D. in Physical Chemistry from University of California, Santa Cruz in United States. He is passionate about scientific communication to introduce cutting-edge research to both the general public and scientists with diverse research expertise. He is a web blog writer for Chem. Commun. and Chem. Sci. More information about him can be found at http://liutianyuresearch.weebly.com/.


")